Lesson 3:
Interactivity in Visual Analytics
20 May 2025
Building Block of Visual Analytics

Revisiting Visual Analytics Framework

Taxonomy of Interactive Dynamics

Source: Heer, J. & Shneiderman, B. (2012) “Interactive Dynamics for Visual Analytics” ACM Queue, Vol. 55, No. 4, pp 45-54.
Data & view specification
- Visualise data by choosing visual encodings.
- Polaris of Tableau

Data & view specification
- Filter out data to focus on relevant items.

Data & view specification
- Slicer is an axis-parallel selection tool, which selects a range along an axis, where the end-point of the interval can be modified dynamically.

Source: crossfilter
Data & view specification
- Sort items to expose patterns.

Data & view specification
- Hierarchical sorting

Data & view specification
- Derive values or models from source data.

View Manipulation: Selection functions
- Pointer selects a single object in a plot.

View Manipulation: Selection functions
- Drag-box selects a rectangular region in a box.

View Manipulation: Selection functions
- Brush is a generalisation of the drag-box. Once a rectangular region is define, the brush allows users to move that region across a plot and thus dynamically change the selected subset.
View Manipulation: Selection functions
- Lasso allows users to define an arbitrary contiguous shape to select data.

View Manipulation: Selection modes

Reference: Mondrian
View Manipulation: Highlighting
- Selected records are highlighted.

View Manipulation
- Navigate to examine high-level patterns and low-level detail.
- Shneiderman’s mantra

View Manipulation
- The scatter plot provides an overview and the bar and line graphs provide detail sales and profits trends overtime.

View Manipulation
- Coordinate views for linked, multi-dimensional exploration
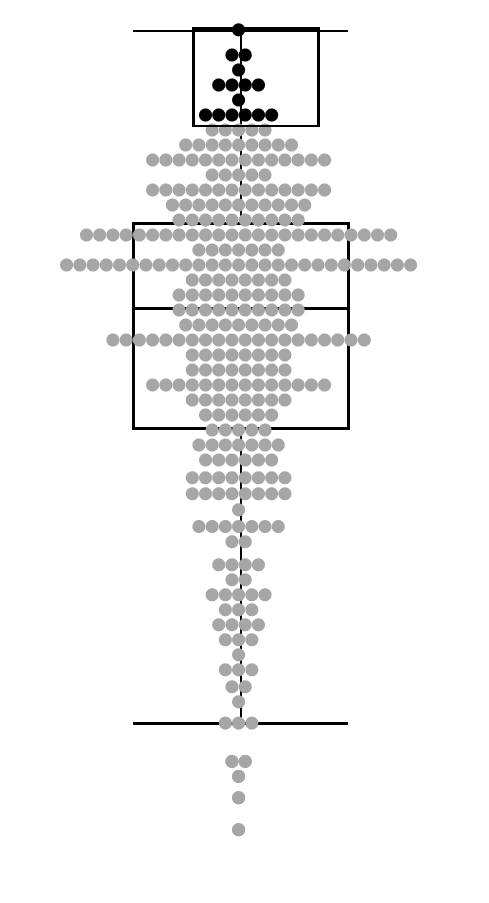
Scatterplot with marginal boxplot

View Manipulation
- Organise multiple windows and workspaces.
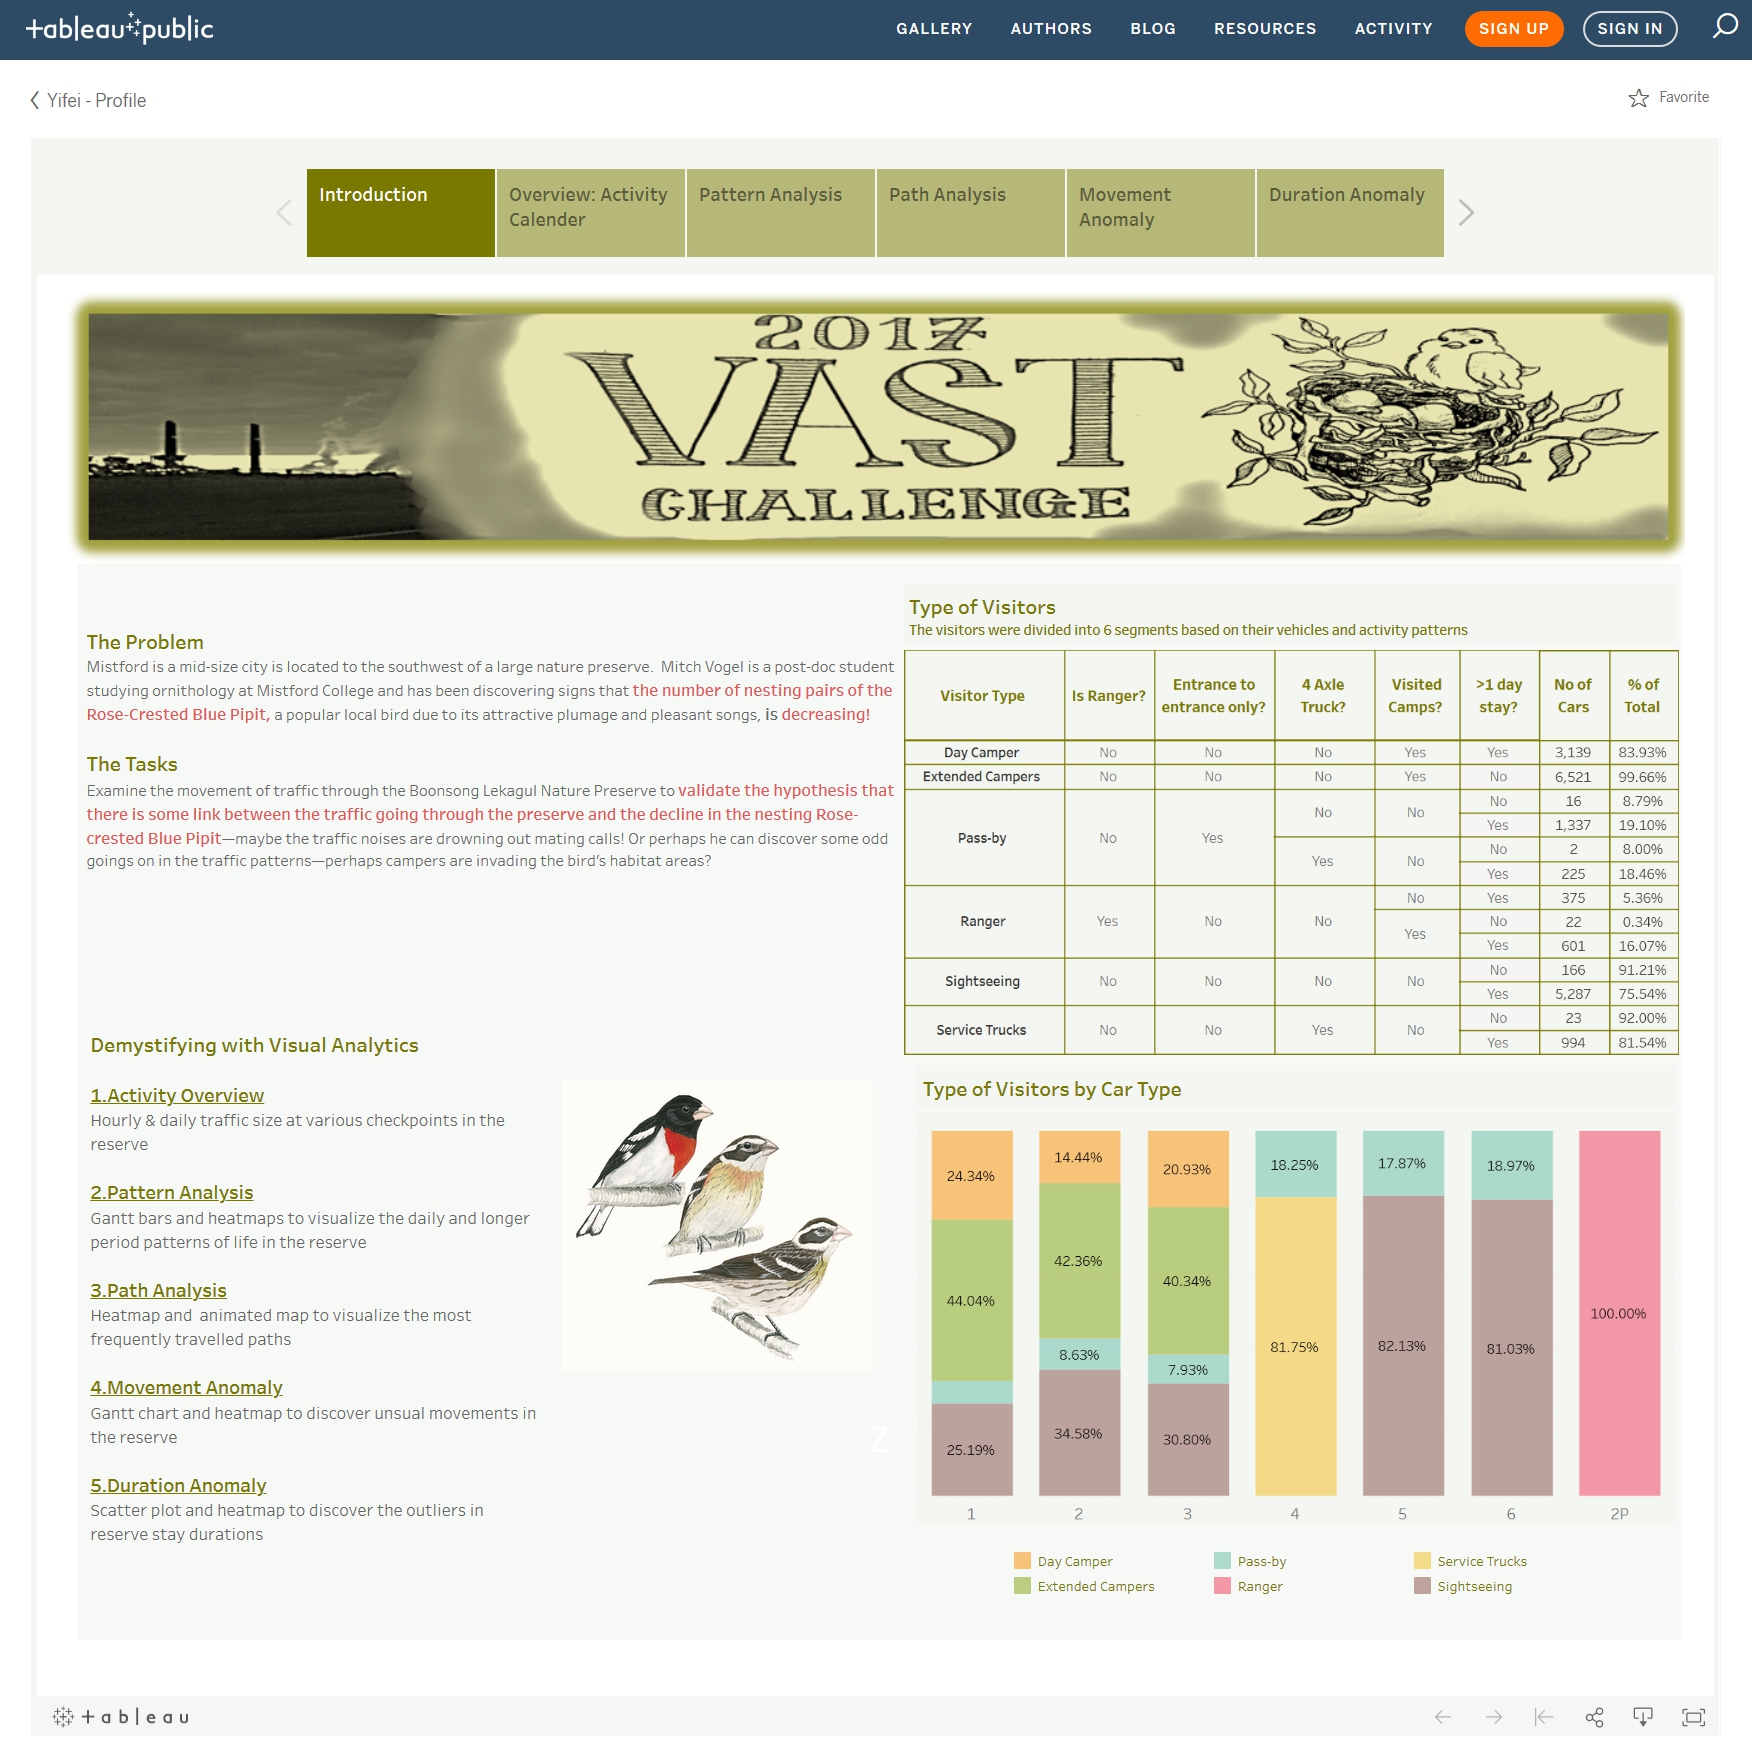
Source: VAST Challenge 2017 MC1 by Yifi
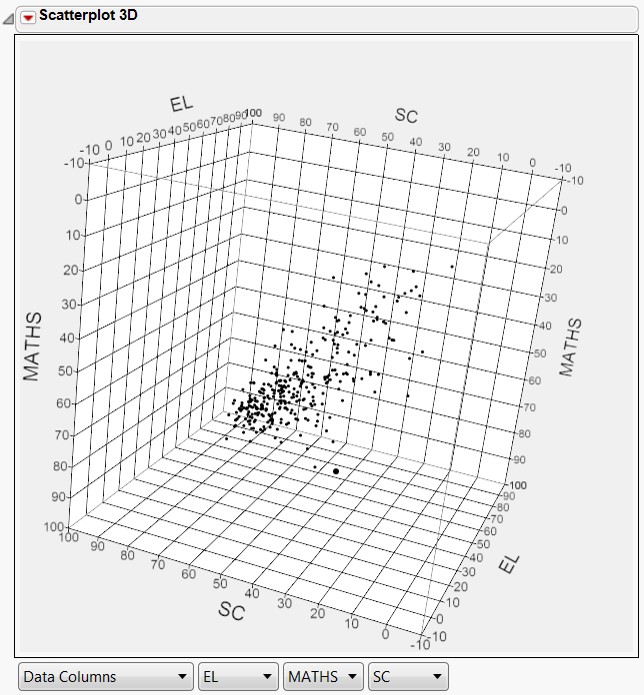
View Manipulation: Rotating
- Touring view with JMP’s 3D scatterplot
Interactive Design Primitive
A framework for effective interactive design in visual analytics application.

Source: Roth, R.E. (2012) “Cartographic Interaction Primitive: Framework and Synthesis”. The Cartographic Journal, Vol. 49, No. 4 pp. 376-395.
Interactive Design Primitive
Visual Analytics Objective Primitives
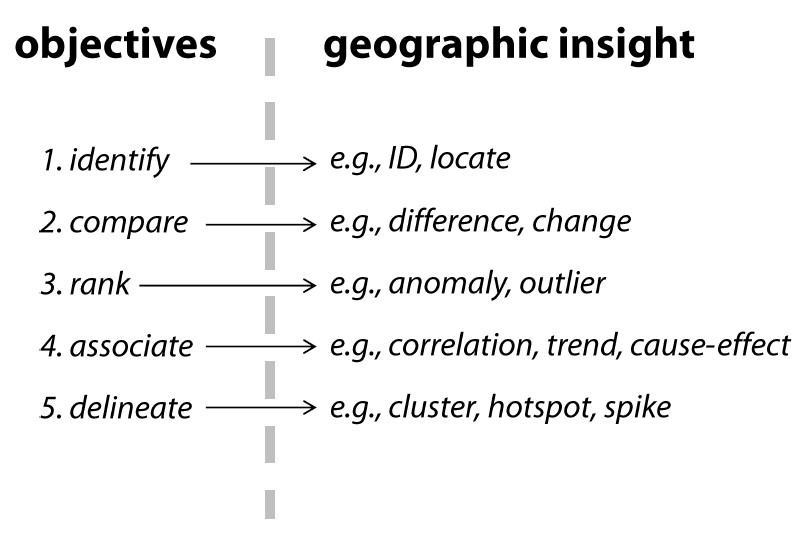
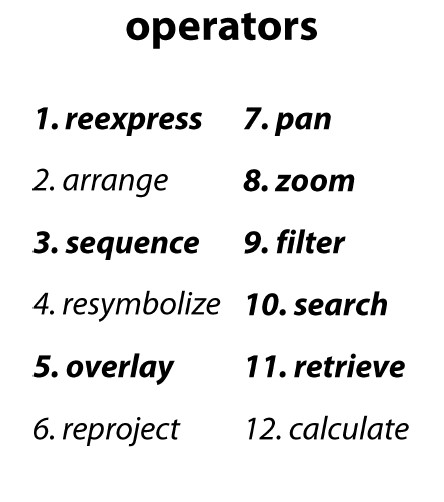
Interactive Analytics Operator Primitives
Interactive Design Primitive

Animation in Visual Analytics
The purpose of animation is to facilitate perception of changes when transitioning between related data graphics
Do not confine to time-series data only
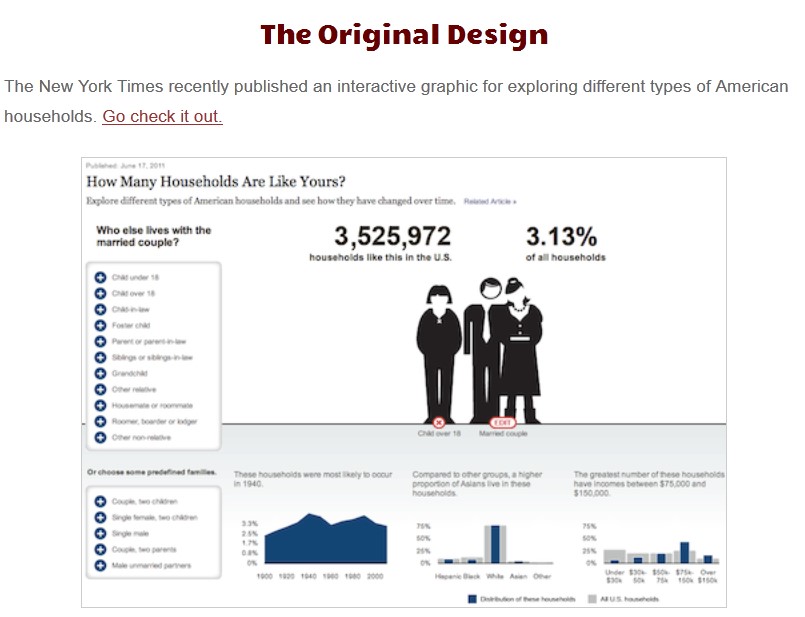
Source: How Many Households

